Like I already hinted at in the previous part, I haven’t been happy with the current solution, that drives The Map. So I have been busy in my spare time, to implement some additional features.
And I know, that still nobody understands a thing or cares much. Yet, you still have to read it. – Or you don’t, if you just don’t read it. I can’t really make you, can I?
The first major change is, that I reimplemented everything in Python, using CherryPy and PostgreSQL instead of MySQL. The reason for the former is simply, that I am much more into Python than PHP. And I thought you could do same sweet little tricks with the Python syntax (list comprehensions, generator functions and all), that bugged me about the PHP implementation. The switch from MySQL to PostgresSQL, I did, because… reasons. I just seem to like PostgreSQL more than MySQL, for no real reason. I don’t actually know if it actually does a better job performance-wise or not. But who cares. The actual slow part is not the database backend.
I also did away with the automatic split of the trip into tracks. But instead you have to specifically start a new one, or actually end the old one. This has several reasons. For one, finding a proper logic for splitting is just hard and error prone. So I’d do it much rather explicit than implicit. Second, I am now able to save stats about a track in the database and don’t have to recalculate the stats on every query. I think I had another reason, two sentences ago. But I forgot… So let’s continue:
Due to my lack of proper mobile Internet, while I was here on the Banks Peninsula, I really needed a way to import a track, from GPX files, OsmAnd creates. So I did that. And it seems to work quite good. It actually works so good, that I am thinking of stopping the online tracking altogether and importing all tracks after I finished them. I mean, the real-time tracking is fun and all, but I don’t think there is anyone of you, sitting all day in front of their computer or phone and watching The Map as I go. Or at least I hope so. oÔ
Then there is this big issue of the amount of data… One thing that really helped was, that I don’t have to recalculate the track statistics all the time. A second optimization I did is, that I actually filter position measurements one they come in (or get imported) instead on every query. Before the rewrite, there was a query-parameter min_distance, which told the server to only send positions at least that many meters apart. Now I am using the HDOP provided by OsmAnd, which stands for horizontal dilution of precision. It has something todo with the mean variation of the position measurements. I just use it as a value for the precision of the measurement. So a measurement has to be at least half of the HDOP value away from the previous measurement, to be saved. Now that I very briefly looked at the Wikipedia article for DOP again, that is utterly wrong and not the meaning of it. But whatever…
All of that didn’t really do anything for you. So here is something, you might like. As you might have discovered already, you can click on a track or a marker to pop up a description. So far it displayed track statistics and the date of the Last Known Position. I further implemented a feature, to make arbitrary markers along a track. I will use this, to highlight Points of Interest and link some of the pictures I took to a specific location.
Additionally, in the ongoing war with the amount of data, I won’t show all tracks on the map by default, but only the ones of the last 2 or 4 weeks. However, don’t be alarmed, the rest is still there, just not visible by default. To show them you have to enable the layer for the time frame you want. Look, I made you a picture to show you how!
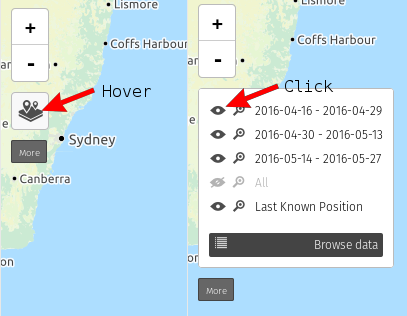
Great isn’t it? Took me all my Paint-Skillz to do it. 🙂
I think that is all for now… There are some other small features, I implemented for myself. Like showing only dots instead of a line, or limiting the number of tracks by number. But that is just something for me, to be able to link those pictures. Because Firefox isn’t so happy if it has to show tens of thousands of dots on a map. I can’t imagine why…
Happy continued stalking!
Nice job! But please don’t dismiss the online tracking feature. It’s like the best stalking thing I’ve ever seen so far! I check it every free minute^^ Maybe just increase the time between two points and interchange them later with the ones from the gpx-file.
In theory you can just import the gpx file, even if there is a track from online measurements already. It’ll just fill innthe gaps. A problem arises, if a point to be imported is between two tracks. Meaning there is only a track that ended earlier and one that started later. Which track does it belong to now? That is just prone to err at some point… And I really don’t like manual maintenance, because there is no interface for that or anything.
I could just use the Online Tracking for the Last Known Position, but, then it’s just some point in the middle of nowhere..
Don’t know yet. We’ll see, what I can do.